Worksheet annotation system ( I )
Worksheet annotation system ( I )
Managing annotations for downstream analyses: Multihit and Single hit CSV files
The collection of GPRO pipelines report annotation outputs using a plain file commonly known as CSV file (comma separated). Here you have an example of CSV-like annotation file, which can be for instance, an excel document saved as CSV. This file can be navigated and interrogated for downstream analyses using a management system called worksheet that consists on a grid of editable cells arranged in numbered rows and columns. As shown in Figure 13.1, CSVs can be opened or created as a new worksheet using the menu tab "Databases" (at the top in red circle). If the CSV is already available in the directory of GPRO you can also open it by double clicking on its icon (below also in red circle). In one way or another, when opening a CSV as a worksheet a pop-up will appear allowing you to adapt GPRO to the format of your CSV via two drop down tabs at the top called Field Separator and Delimeter (note that CSVs contains columns of data that may be separated by spaces, commas, semicolons etc). By selecting or deselecting the option below “worksheet contains multiple HSPs for each match” the interface also allows you to decide if the CSV should be open as a multihit file, which is the default option, or as single hit file (indicated with a blue arrow).
Multihit files are CSVs collecting more than one hit matched per each query. Following is an example to better explain it.
If you perform a BLAST search via the functional analyses pipeline and subsequently process the resulting Xml files with the GUI called “Process BLAST outputs” you can decide to take a number of best hits (for more details see the section Process BLAST outputs in the chapter Functional Analyses). The result of this procedure is a CSV containing as many rows as number of best hits detected per query.
If you open a CSV not selecting the option “worksheet contains multiple HSPs for each match” the worksheet will list all the hits for all the queries contained in the CSV. However, if you take the aforesaid CSV and open it as a worksheet with the multihit option selected, what GPRO will do is to create two coupled CSVs that respectively constitute the “reference” and the “master” files of the annotation to open as worksheet. Bear however in mind that if you only took one best hit during the previously performed processing of Xmls you will only have one hit per query independently if you open or not the CSV with the multihit option selected.
The reference file has the same name you gave to the CSV and the master file has the same followed by the additional “_multiHit” tag (Figure 13.1 rounded in blue) and it will be automatically opened as a worksheet summarizing as many rows as queries and showing only the most significant hit per each query (the best of the best hits) according to the obtained BLAST score and e-value. If your analysis was not a BLAST search, you can select the columns on which to base the best hit selection.
If you click on the row (we will explain this more carefully in the next sections of this chapter) a pop up will appear with a summary of all detected hits for each query so that to let you to see how many alternative hits does each query have or to switch the hit selected as representative per any other in the summary (for more details see the next sections of this Chapter). This is possible because the reference file is linked to the master file that is the original annotation containing all hits per query. From that point on, you need to preserve both files together in the same directory as if you remove the master file you will lose the original annotation and the option to see all alternative hits for each query. If you want to open again the annotation worksheet you only need to open the reference CSV. You do not need to open the master (which in some way is a security copy) unless you would prefer to repeat the multihit process again (well because you did something wrong or because you want to make a selection of your data according to various criteria and/or items) as if you directly open the master file with multihit option selected you will again create two coupled files a reference labeled as “_multihit” and a master file twice labeled as _mutlhit_multihit.
|
Figure 13.1.- Opening CSV files as multihit or single hit worksheets. CSVs can be opened using the menu tab Databases or, if the CSV is available in the directory, you can also make double click on its icon (in red circles above and below). Then a pop-up interface will appear allowing you some options to adapt GPRO to the format of your CSV. Among these, GPRO permits you to open your CSV as a Multihit (the default mode) or as a Single hit file (blue arrow). If you select to open your CSV using the Multihit option your original CSV will become into two couple files (in a blue circle) you can consider as reference (the file to work with) and the master (the backup). |
Worksheet overview
The worksheet is launched in the main desktop and implements a wide variety of functions to: a) create and remove rows and columns; b) import, export and combine databases on the basis of a selection of rows and/or columns; c) add, search and replace annotation terms based on commonly used taxonomies and vocabularies; d) organize and color the cells according to key terms such as mapping, annotation, function, statistics; e) perform functional annotation based on the Gene Ontology vocabulary (GO) and/or to retrieve metabolic maps from the Kyoto Encyclopedia of Genes and Genomes (KEEG); f) switch accessions between refseq databases; g) make data mining and downstream analyses; h) statistics, etc. In addition, the worksheet can be linked to a sequence FASTA database and make changes simultaneously in the worksheet and the database. Figure 13.2 shows a screenshot of the GPRO worksheet.
|
Figure 13.2.- Worksheet screenshot: A) menu bar and functions; B) Column headers; C) Grid of cells with numbered rows and columns, which can be selected by clicking on the corresponding checkboxes; D) Information concerning availability of a link between the worksheet and FASTA database. |
Following is detailed the default columns implements by GPRO in CSV outputs. It is worth to note that you can add/remove columns and rows by right-bottom clicking with the mouse in any place on the worksheet. You can also move a column from one position to another by left-bottom selecting and dragging it with the mouse.
| Sequence | Your sequence/query name or label |
| Subj. mapping | The database subject mapped using your query |
| GI | Gene identifier (if available) of the subject |
| Accession | Accession number (if available) of the subject |
| Species | Host species |
| Score | Scoring for the alignment between query and subject (the HSP or alignment core between the query and the subject). |
| E-value | Statistics associated with the alignment between query and subject. The interpretation is the lower E-value the more significant result, with the exception of the case of the perfect hit (one sequence against itself), where BLAST usually assigns an E-value of "0". |
| Query-from | Query sequence start position in the HSP |
| Query-to | Query sequence end position in the HSP |
| Subject-from | Subject sequence start position in the HSP |
| Subject-to | Subject sequence start position in the HSP |
| Query frame | Frame of the query |
| Subject frame | Frame of the subject |
| Identities | Degree to which two the query and the subject are invariant. |
| Positives | Number and fraction of residues for which the alignment scores have positive values |
| Query length | Length of the sequence query |
| Subject length | Length of the sequence subject |
| Align length | Length of the HSP or core alignment between the query and the subject |
| Similarity | Sequence similarity between the query and the subject |
| Hsp/Query | Coverage between the HSP and the query |
| Hsp/Hit | Coverage between the HSP and the subject |
| GO# | Number of GO terms detected |
| GO | Summary of GO terms detected |
| Evidence codes | Evidence code of GO annotation |
| Enzyme codes | Enzyme codes based on KEEG classification |
| InterProScan | InterProScan classification equivalence for each GO term |
| Comments | To take notes about this sequence |
As previously shown in Figure 13.2, the worksheet of GPRO is implemented by its own menu of utilities in addition to those available via mouse actions. The first tab “File” (Figure13.3) provides a drop-down summary of utilities. A brief description of each utility follows.
Open worksheet
To launch pre-existing CSV files as worksheets
Save
To save changes performed in the opened CSV
Save as
To save a worksheet as a new CSV
Download GenBank Accession files
To download sequences (as annotation files or as sequences) from GenBank using GenBank Accessions selected from a worksheet column
Download sequences by GI
Download sequences from GenBank using the Gene Identifier (GI) accession selected from a worksheet column with the possibility to define the full-length annotated sequence or a core with start and end positions determined by other columns of the worksheet.
Set as default worksheet
To set a CSV file as default worksheet (It will be opened automatically when launching GPRO).
Unset as default worksheet
To unset a CSV file as default worksheet
|
Figure 13.3.- File Tab of the worksheet GPRO menu. You can save a worksheet into a CSV or set or unset a CSV as a default worksheet. By selecting the options “Download GenBank Accession files” or “Download sequences by GI” two distinct pop ups will appear to automatically download sequences or annotation files based on GenBank Accession or its GI. |
Import
This utility allows you to join two or more CSVs (from two or more annotations) using three different options - “Append worksheet”, “Combine worksheets” and “Clusters”
Append worksheet
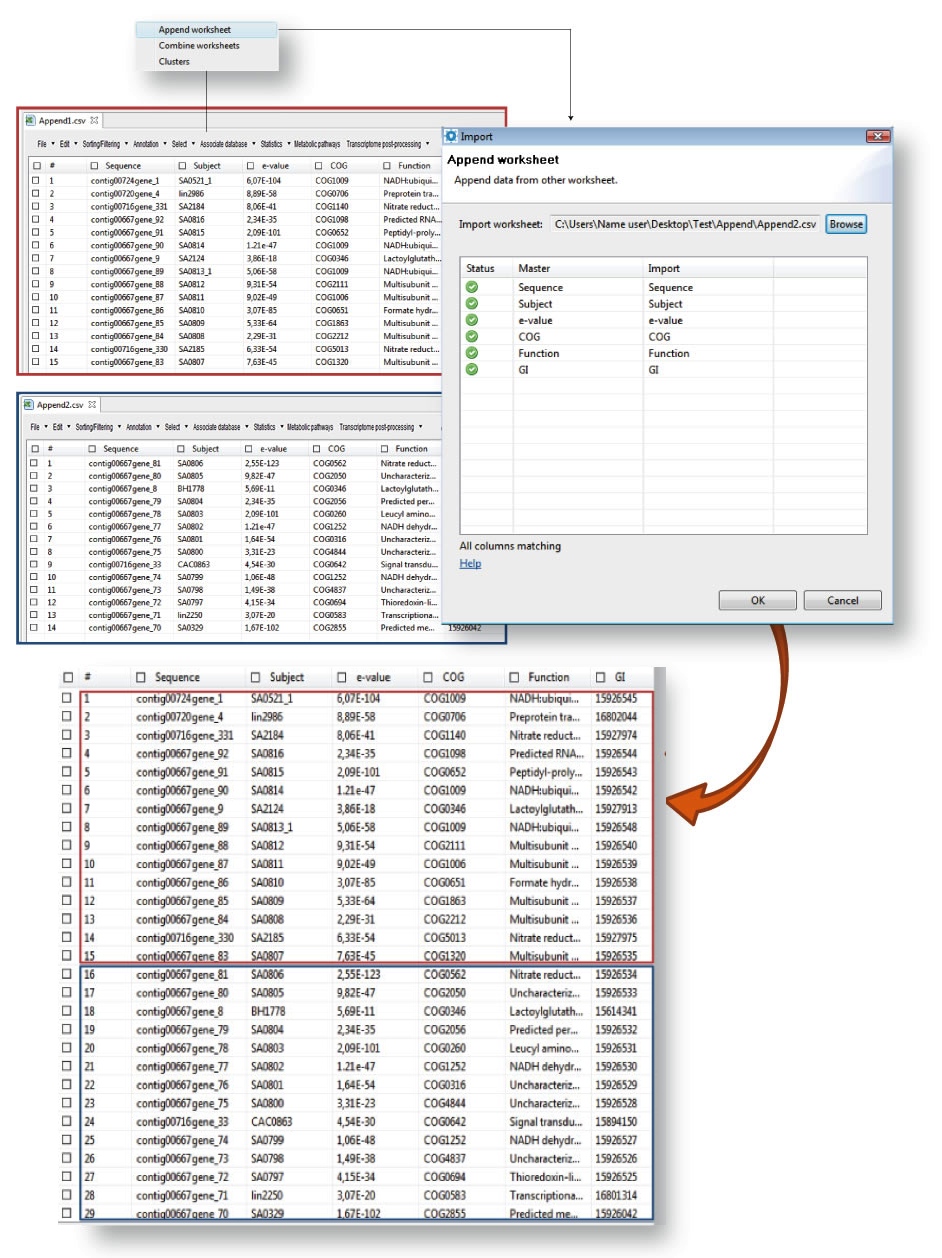
You can use “Append worksheet” for merging two CSVs using one of them as a template (Figure 13.4) provided that all CSVs have the same number of columns and with the same name. Go to “import” > “Append worksheet”. GPRO will open a window in which you can browse the worksheet from which you import the data using the “Import” tab of the dialog. The grid of this dialog shows the name of the columns available in each worksheet. If the names are accompanied by a green icon in the section “status”, the column names are identical and you can proceed to join both worksheets. If any status icon appears in red please revise the names of the two worksheets to make them to coincide before running the utility.
|
Figure 13.4.- Append worksheet. Open the CSV you want to use as template (outlined red in the figure). |
Combine worksheets
The utility “Combine worksheets” is for combining data from two CSVs into a single worksheet using a common column as a join reference (for instance, the column with the sequence name or identifier). Note that the difference between this tool and "Append worksheet" is that while the latter add new rows (i.e. new sequences to annotate in your database project), "combine worksheets" adds new columns with new information (taxonomy, ontology, etc.). The utility is useful for joining results of two comparative analyses (for instance, two independent BLAST searches against two different Refseq databases). Figure 13.5 shows a graphical description how to run Combine worksheets. To do this, select the option “combine worksheets” within the utility “Import”. Then (1) a GUI will appear for you to browse the CSVs you want to respectively use as template or master and as related worksheet. (2) A drop-down dialog called "Key Column" is available for each case in order to you to select the column common to both worksheets (remember that this column must contain identical labels). (3) Below this dialog you have a list presenting the distinct columns of each file you want to join. Check the columns you want to combine for each worksheet, and (4) browse an output CSV to save the new project and click OK to run the function.
|
Figure 13.5. Combine worksheets. This function allows you to export columns from a worksheet to another using a column that is common to both worksheets as a join reference (identical row labels or terms, for instance sequence names). |
Clusters
If you have previously identified cluster or family relationships (for example, paralogs repeats or MGEs related to one another) among the sequences of your annotation, you can add this information to the worksheet using the utility “Clusters” and a cluster file (cluster file) in CSV format containing the clustering information distributed in as many columns as names of related sequences (the members of a cluster), and as many rows as clusters (framed in blue in the example). Figure 13.6 details the process.
|
|
Export
To export a set of annotated sequences, the worksheet allows you to perform a variety of selections on the basis of distinct row/column criteria (function, host, E-value, ontology, etc.) described in next sections of this manual. If you are ready to export results, click on the "Export" option in the "File" command of the worksheet. You can choose among one of three possibilities, "Export CSV & FASTA", "Export Annotation file" and “Export categories & clusters”.
Export worksheet and FASTA
This option provides the possibility to export results in three modes: first, as a new worksheet; second, as a new worksheet coupled with an associated FASTA database with the sequences´ FASTA headers labeled according to annotation terms; and third, as a FASTA database with the annotated sequences. Figure 13.7 illustrates graphical description. In the first and third modes, note that you need to have a reference sequence database previously associated to the worksheet. To learn how to do this, see the menu tab "Associate database". In all exporting cases, it is required that you check rows and columns for exporting the data.
|
Figure 13.7.- Exporting worksheet and sequence data. You can export a selected subset of your CSV into another CSV or this subset coupled to a subset of fasta sequences you can click on the Tab file and select the path Export”>“Export CSV & FASTA”. You have three options: A) “Worksheet & fasta”, which lets you to export a CSV coupled with a FASTA database if there is a previous worksheet-database association (to do this see the menu Tab “Associate Database”). B) “Worksheet only” that only exports the selected subset into a new CSV. C) FASTA only”, which exports the subset as a fasta file (again it there must be a previous association between the worksheet and a reference sequence database). In all exporting cases, it is required that you check rows and columns for exporting the data (step indicated with hand icons). |
Export annotation file
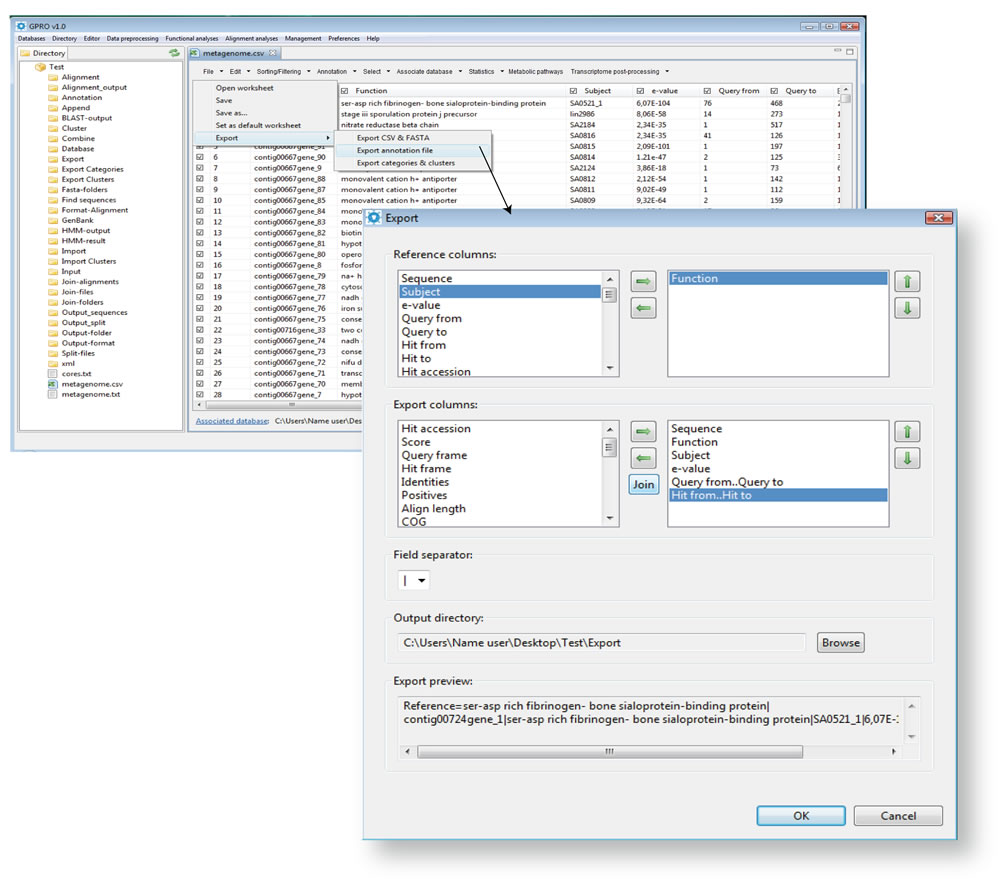
This section is for exporting annotated sequences (rows) from the worksheet using one or more columns as the reference for the annotation records and other columns as records´ features. The exported output is a plain text file (named “Annotation” in all cases) with the annotation information usually organized in pairs of lines for each worksheet row (i.e. the annotated sequences) except for those that share header information. As shown in the example below, the first pair is the annotation header and provides information about the organization of the annotation in the file.
Reference=Query def|Function|
Hit def|Hit accession|Score|e-value|Query from|
The first line of the head indicates which columns (separated by bars) have been selected as the annotation references. In the example above, these are "Query_def" and "Function". The second line sets the order assigned to the distinct columns (separated by bars) you select as the subject. In the example above, distinct columns are called "Hit def", "Hit accession", "Score", "e-value" and "Query from". The remaining pairs correspond to the distinct sequences annotated (one pair for each sequence) according to the header organization. Four examples of annotation follow.
Reference=contig00720gene_4|stage iii sporulation protein j precursor|
lin2986|179848|608|8,06E-58|14|
Reference=contig00745gene_4|nitrate reductase beta chain|
SA2184|114419|2535|0|1|
Reference=contig00667gene_92|general stress protein 13|
SA0816|113083|409|2,34E-35|41|
Reference=contig00667gene_91|peptidylprolyl isomerase|
SA0815|113082|982|2,09E-101|1|
If some rows reveal a share of the header (for instance, duplicated or related ORFs within the same contig or scaffold), they will be grouped into a cluster with as many lines as there are rows sharing the header. See the example below.
Reference=contig00667gene_89|monovalent cation h+ antiporter|
SA0813_1|4920|2617|0|1|
SA0812|113080|574|2,12E-54|1|
SA0811|113079|525|9,02E-49|1|
SA0810|113078|2008|0|1|
Reference=contig00667gene_70|membrane protein|
SA0329|112610|994|1,67E-102|1|
SA0794|113062|1871|0|1|
SA0792|113060|207|5,95E-12|1|
Figure13.8 presents a graphical description of this process and the format with which the data are annotated in the output file.
|
Figure 13.8.- Exporting annotations. To export your annotation results the option "Export annotation file" lets you prepare and export the annotation via the worksheet. Select the path Export >“Export annotation file” available within the “File” worksheet command. The format of annotation followed by GPRO is a summary of records organized into pairs of lines for each annotated row except for that sharing header information. The first line of the output file is the item header, created by selecting one or more reference columns to refer to each item in the annotation. To make the header selection, move any column you want to use as header (they can be one, two or more) from the dialog list called “Reference columns” to the adjacent area using the transferring arrow between these two dialogs. You can the reorganize the order of reference columns in the annotation header using the vertical arrows. Select the columns you want export as annotation features and move them from the dialog list “Export columns” to its adjacent. The procedure is identical to that for the “Reference columns” but in this case you have the additional option of joining the information from two columns into a single one. You can select the type of field separator you want to apply to separate columns in each annotation item (by default, a vertical bar). Finally, the program presents you with a preview of the exporting format at the bottom of the window. If this is correct, press OK for running the automatic annotation export. |
Export categories and clusters
This function allows the user to export sequence rows as categories (one file per category) or clusters (sequence pools created on the basis of common features and exported to a single file). The selection is performed, by taking into consideration a term repeated in, or common to, distinct rows within the column you select as a reference (function, clades, host species, etc.). Figure 13.9 illustrates the process to be followed in order to export rows by categories.
|
Figure 13.9. - Exporting rows in categories. This tool allows you to export sequence rows by categories in distinct files (one file per category) on the basis of common features in a column selected as a reference as follows. 1) Check the rows (the output units) and columns (the information associated to each row) you want to export and follow the path Export” >“Categories & clusters” available in the “File” command of the worksheet menu. A windows dialog will appear. 2) Select a destination folder where the generated files will be stored and the worksheet column you want to search for common terms. In addition, a summary of the distinct worksheet columns is available for you to add or remove columns. 3) Check the exporting option (in this case “Categories”) you want to use and press OK for running the utility. 4) The output folder “Export Categories” will contain all CSV files generated by this tool that were divided into distinct files according to the recurrence of common terms in the searched column called “function”. 5) An example of a generated file displaying the terms grouped by the same “function” category (framed in red in the input worksheet). Here (Here) you have an example of template CSV and folder output resulting from this analysis. |
The process for exporting clusters of related rows within a single file is almost identical to that previously described in the Figure shown above for exporting categories. Figure 13.10 depicts the procedure. If the worksheet in use is associated with a database, the “Export categories & cluster” function will provide the corresponding FASTA files for the sequences of the categories and clusters obtained.
|
Figure 13.10.- Exporting rows in clusters. You can export sequence pools as clusters of rows created on the basis of common features in a column selected as a reference. The procedure is the same as that shown for exporting categories. 1) Check the rows and columns you want to export and follow the path “File”>“Export” >“Categories & clusters” in the worksheet menu. 2) Select a destination folder to deposit the output file into and the key column in the worksheet you want to search for common terms. 3) Check the exporting option (in this case “Clusters”) you want to use and press OK to run the utility. 4) An example of a “Clusters file” where sequences with the same function were clustered (framed in red in both “Clusters” and worksheet files). |
Show/Hide columns
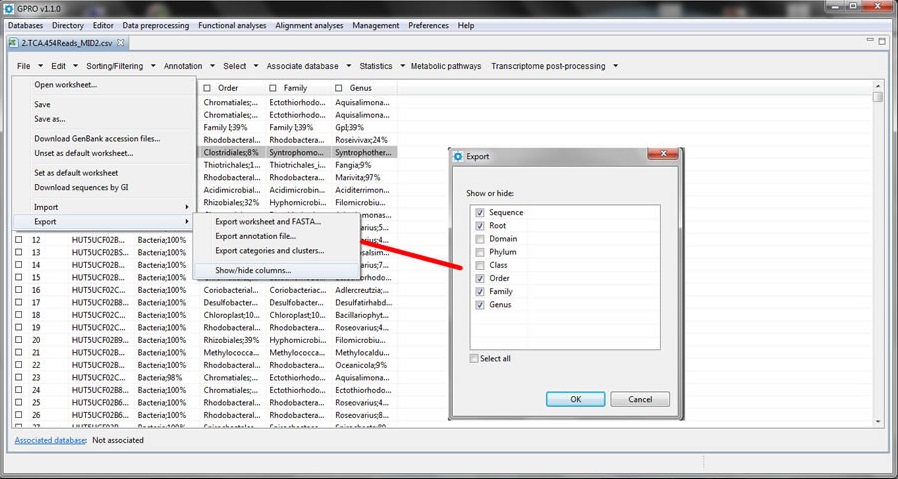
This function allows the user to select which columns to show or hide in the worksheet. You can select the columns you want to show (or export) by manually clicking on the checkbox at the top of each selected column using the mouse (Figure 13.11).
|
Figure 13.11.- Hide/Shows column screenshot. |
Search and replace
This utility works identically to that previously discussed in the Database Editor but applies the search and replacement of labels within the Worksheet. By selecting this utility, a dialog is opened for you to choose between two utilities - "Search" or "Replace".
Undo
Undo the last actions performed.
Sort
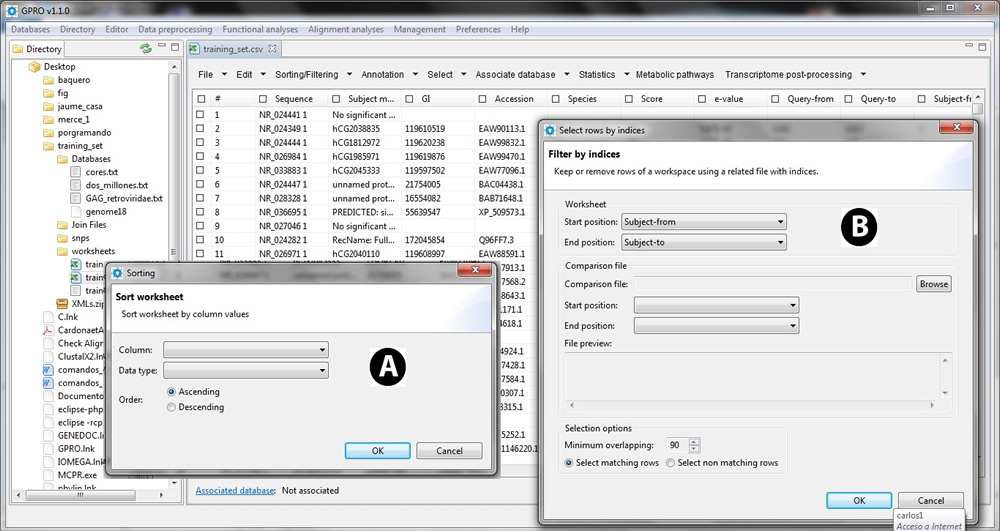
Worksheet contents can be organized according to the ascending or descending order established in a column. As shown in Figure 13.12A, use this function to select the column of reference and type of data (text or numerical data), then decide the ordering. The whole worksheet will be rearranged according to your choice.
Filter by position
In most cases, you can have two separate annotations from the same genome performed using for instance two different RefSeq databases as queries. This function allows you to filter mapping positional redundancies (using a minimum overlapping) between both files using the starting and ending positions and then keep in one annotation file that that was not captured by the other or vice versa. Figure 13.12B shows a screenshot of this function.
|
Figure 13.12.- Sorting/Filtering. A) Sort. B) Filter by position positional redundancies between two annotation files. |
Go to "Section II" of the Worksheet system description Return to Index


