Worksheet annotation system ( II )
Return to Index Return to the "Section I" of the Worksheet system description
Worksheet annotation system ( II )
This Tab offers diverse options for functional annotation based on the most frequent ontology vocabularies and classificatory systems or according to personalized criteria such as levels of significance (non-significant hits, mapped sequences, annotated sequences, etc). Here you can also switch sequences IDs between distinct classification systems (GeneBank, Ensembl, Uniprot etc).
GO annotation
The Gene Ontology (GO) ontology (Gene Ontology Consortium 2008) is a muti-disciplinary initiative created with the aim to provide a controlled vocabulary of terms for describing and annotating gene product data. GO is a component of the Open Biological and Biomedical Ontologies (OBO) for shared use of vocabularies across different biological and medical domains.
GO covers three domains:
- Cellular component (C) which correspond to the parts of a cell or its extracellular environment;
- Molecular function (F) that collects the elemental activities of a gene product at the molecular level such as binding or catalysis
- Biological process (P) which describes operations or sets of molecular events with a defined beginning and end, pertinent to the functioning of integrated living units: cells, tissues, organs and organisms.
By default the device processing BLAST outputs available in the GPRO pipeline for "BLAST and HMM search Pipeline plus GO-annotation" automatically adds Gene Ontology (GO) annotations to your BLAST results. However, if your do not need/want to perform BLAST searches (because they have been already done with other tool) you can use the GPRO worksheet for adding GO terms plus KEEG enzyme codes (EC) to your data provided of that they are row-to-row summarized in a CSV and accompanied by at least an additional column with sequence IDs (such as those of Genbank, Uniprot, Interpro etc) that GPRO can process and appropriately associate with respective GO IDs and terms.
The EC is a number assigned to a type of enzyme according to a scheme of standardized enzyme nomenclature found in ENZYME, the enzyme nomenclature database, and KEGG: Kyoto Encyclopedia of Genes and Genomes. InterProScan is an integrated database of predictive protein signatures (Quevillon et al. 2005) used for the classification and automatic annotation of proteins and genomes, available at EBI.To read more about the GO initiative, go to geneontology.org
The Clusters of Orthologous Groups (COGs) of prokaryotic proteins and their (KOGs) eukaryotic counterparts (Tatusovet al. 2003) are two collections of prokaryotic or eukaryotic proteins classified in ortholog groups of different species (or paralogs derived from duplication of a single gene within a genome).
Append GO terms
Once uploaded an CSV with your gene data to the worksheet you can add new columns containing the GO terms, GO IDs, Enzyme Codes (ECs) and InterProScan IDs by clicking on the tab "Append GO terms" as summarized in Figure 14.1.
|
Figure 14.1.- GO annotation. To add new columns containing GO terms to the worksheet: 1) open the window dialog of function “Append GO terms” available in the worksheet-tab called "Annotation"; 2) Use the drop-down selectors called "Column name" and "Data type", respectively, to select the worksheet column containing the “IDs" of the mapped sequences and the type of IDs, which must be “GIs” or “Uniprot” IDs . If you mapped your sequences using GenBank accessions use the function "Switch GI/accession" also available in the command "Annotation" to convert GenBank accessions to GIs; 3) Use the mouse to select the annotation columns you want to append to the worksheet based on the GO system and its related nomenclatures (“GO”, “EC”, “InterProScan”); and 4) click OK. If you select the three features, GPRO will add three new columns to the worksheet (framed in red), providing annotation information for each sequence (row). |
Evidende code weights
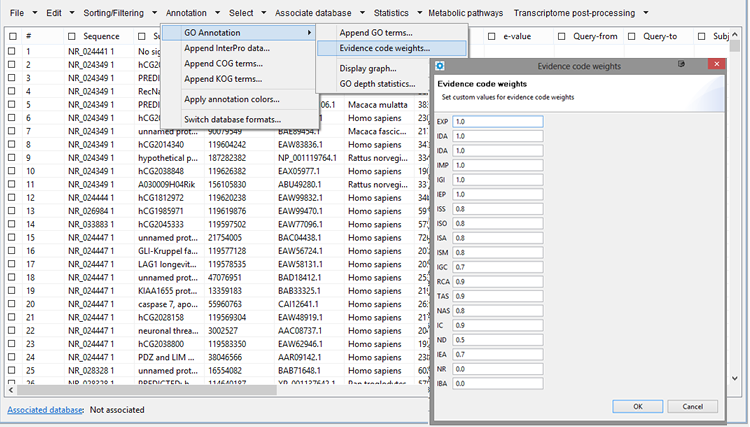
GPRO follows an algorithm of GO annotation inspired in that previously applied by BLAST2GO (Conesa et al. 2005). Using this tab you configure distinct weigths to the evidence codes of your GO annotation.
|
Figure 14.2.- Evidence codes manual configuration. |
Display graph
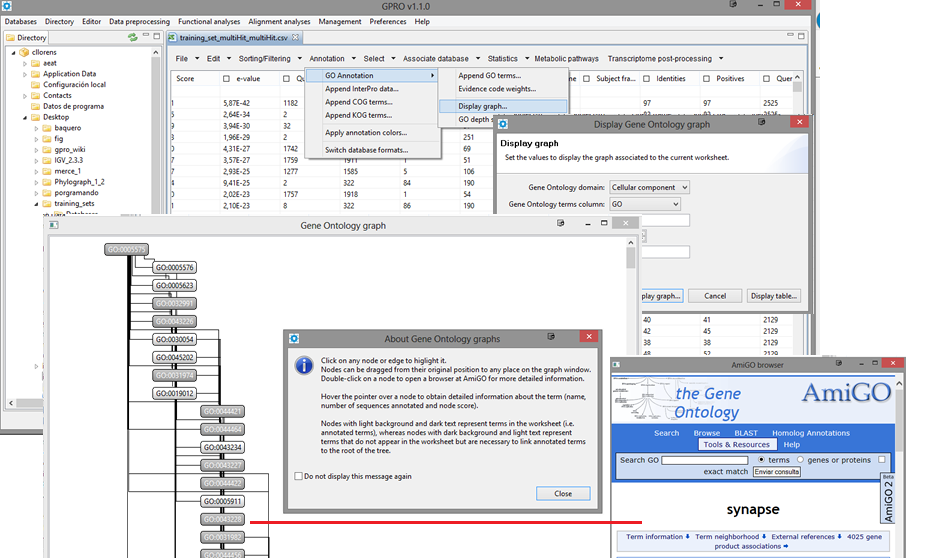
GO Annotation results can also be visualized as directed acyclic graph (DAG) by selecting the option Display Graph available in the submenu of the Annotation Tab. By clicking on any GO term within the DAG.
|
Figure 14.3.- Displaying and browsing the DAG, whose nodes and edges can be moved or edited manually. By clicking on any particular node the tool links to the AmiGO browser of the GO consortium for searching the term selected. |
GO depth statistics
By selecting the tab "Annotation" -> rigth submenu "GO Depth statistics" the tool allows you to obtain Bar or Pie chart figures constructed based on any of the three "Cellular component", "Biological Process" or "Molecular fucntion" domains (Figure 14.4) with distinct filters considering number of sequences, distance decay, node score, DAG level, graphic type and color etc. A graphical representation will appear in the working space layout of GPRO (below). By rigth clicking on the imagen you can export it as an image or as matrix table (option shaded in the pop-up at the rigth and below in the figure) in a csv for further graphical representation with any other tool (Excel for instance).
|
Figure 14.4.- Creating graphical images based on the GO annotation at the DAG. |
Append InterPro data
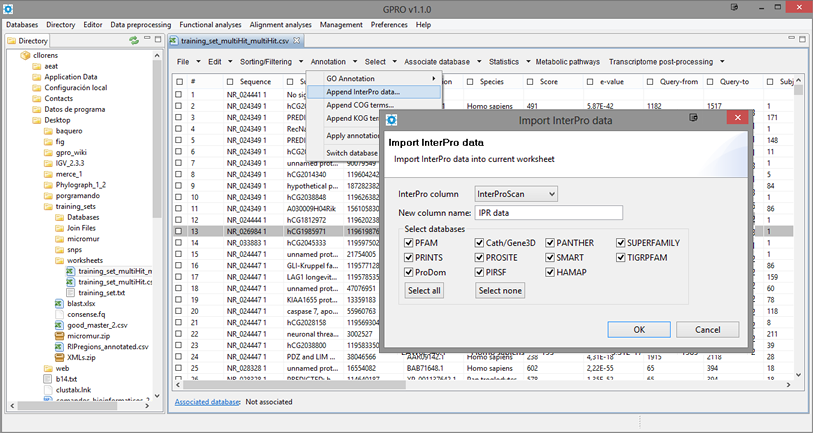
This utility lets you to add new information to your annotation based on the IDs of any or all the InterPro-like databases contemplated by InterProScan (Quevillon et al. 2005). As shown in Figure 14.5, you only need to launch the utility, select a reference column, give the name to the new column to created and then check any or all the databases implemented by InterProscan. For more details about the InpterPro innitiative, go to InterPro Site.
|
Figure 14.5.- Adding InterPro Database IDs to your annotation. |
Append COG/KOG terms
To do this, it is necessary to have previously mapped your sequences (via a BLAST search) to the Refseq COG and KOG databases integrated in the NCBI Conserved Domain Database (CDD) (Schug et al. 2002) available at the FTP of the NCBI. For details about how to perform a BLAST search see the section "BLAST and HMM Pipeline".
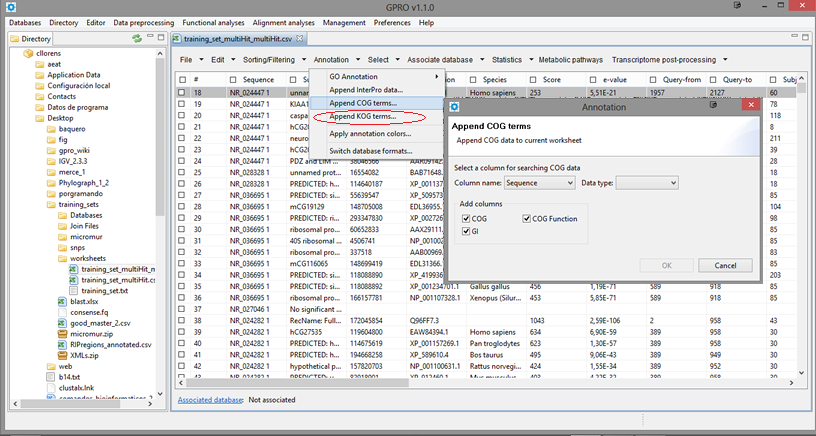
Once you have the CSV resulting from the COG/KOG automatic annotation you can use the Worksheet utility "Annotation" to add COG or KOG terms to your CSV by clicking on the tabs "Append COG terms" (if you are annotating prokaryotic orthologs) or "Append KOG terms" (if you are dealing with eukaryotic orthologs) by choosing the column of reference (“GI”) and the type of data contained in this column (“gi” or “Protein names”). Finally, Check the boxes below this dialog to choose the COG/KOG terms you want to append to the worksheet by adding two or three new columns and click OK.
|
Figure 14.6.- Appending COG or KOG terms to the worksheet. The image summarizes the process for appending GOG terms. The process for appending KOG terms is identical but just following the submenu path below (rounded in red) |
Apply annotation colors
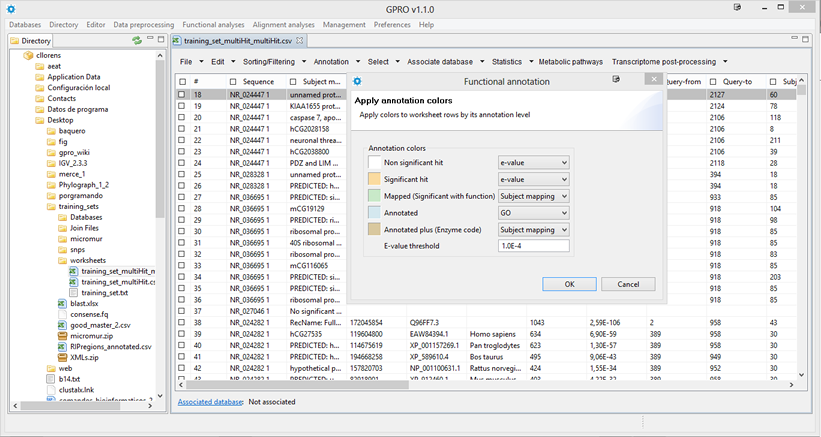
As shown in Figure 14.7, this utility is for configuring specific preferences for your worksheet. It allows you to set the colors to be applied to the worksheet's rows according to the following annotation criteria:
- Non-significant hits: rows containing null or E-values higher than the threshold value specified by the user (in white).
- Significant hits: rows containing significantly lower e-values than the threshold value specified by the user (in orange).
- Mapped: rows containing significant hits and GO codes (in green).
- Annotated: mapped rows that also contain Enzyme Codes (in steel blue).
- Annotated plus: annotated rows that contain other annotation criteria (in dark goldenrod).
The box for e-value threshold can be edited for you to type thre threshold of your choice.
| Figure 14.7.- Apply annotation colors. Select “Apply annotation colors” in the Annotation tab and a window dialog is open, select the columns to which you want to apply the available criteria and click Ok,.the resulting worksheet will display the rows colored according to these criteria. |
Switch database IDs
The GI is an identification number for nucleotide and protein sequences, while the accession number of such sequence represents the database record of a sequence in GenBank a database where nucleotide and protein sequences from more than 260,000 organisms are publicly available thanks to an international collaboration among the NCBI, the European Molecular Biology Laboratory (EMBL) Nucleotide Sequence Database and the DNA DataBank of Japan (DDBJ).
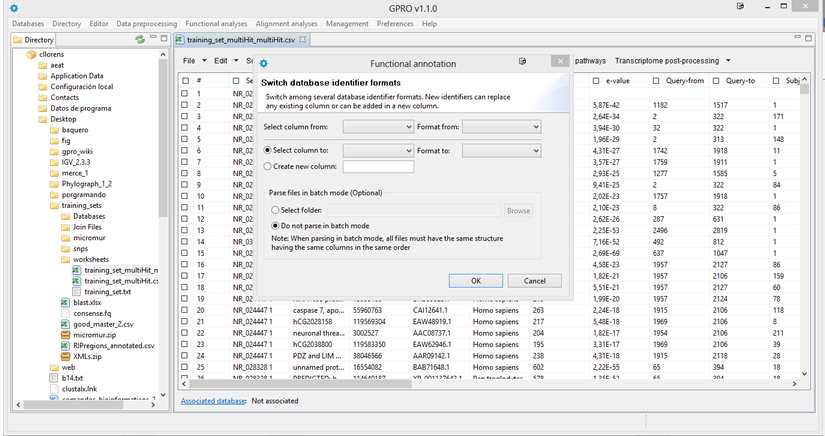
As shown in Figure 14.8, you can switch from an Accession Number to its corresponding Gene Identifier (GI) or vice versa or from a database ID into another database ID by selecting "Annotation" -> "switch database format", a dialog will appear for you to choose a worksheet column in the dialog "select column from" and type of data in the dialog "Format from". Then you have two options a) to select a preexisting column via the boxes "Select column to" and "Format to" if you want replace the terms of this column; b) to create a new column with new information where just need to give it a name.
The tool permits you to make this process in two modes, first applying the changes directely on a CSV open via the GPRO worksheet or in batch mode (by selecting the option Select folder in the figure, below) to process several CSVs simultaneously.
|
Figure 14.8.- Switch database IDs. You can change the GI terms to accession numbers or vice versa. |
To select specific rows of the worksheet (for export/annotation purposes) by using different selection criteria (terms, colors, etc.). Any of these can be combined with the "Export" function available in the first worksheet tab "File" to create subsets from your database or annotation.
Select sequences by key terms
To select sequences (i.e. rows) by performing a selection using specific terms in any column as described in Figure 14.9.Clicking on “Select key terms” will offer a new dialog. Press the "Add" tab, and enter as many terms as you want to select and color rows representing sequences with such label within a particular column (you should specify). As a result, the rows matching the terms selected will be checked in the worksheet and highlighted with the assigned colors.
| Figure 14.9.- Select sequences using key terms. |
Select sequences by expect or statistics values
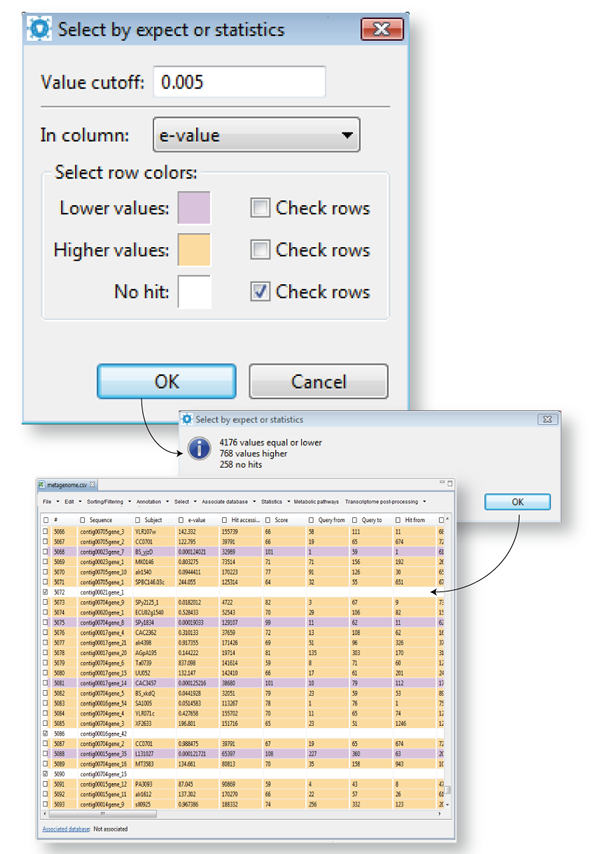
This selection can only be performed on columns containing numerical data. According to the chosen value cutoff, you can make the selection of sequences using the statistical significance of your values as a criterion (for instance, a column containing e-values shown in Figure 14.10). Just enter a value cutoff criterion, and choose a numerical column of reference. The utility will differentially color rows with lower and higher values and others with non-significant hits according to the established selection of colors in these tasks. You can modify the colors code by clicking in each color box and can tell GPRO to check in the worksheet, the rows emphasized in any color (as shown in figure). Then click OK for running the script.
| Figure 14.10.- Select sequences based on e-value expects or statistics values. |
Selecting set of sequences differentiated by colors
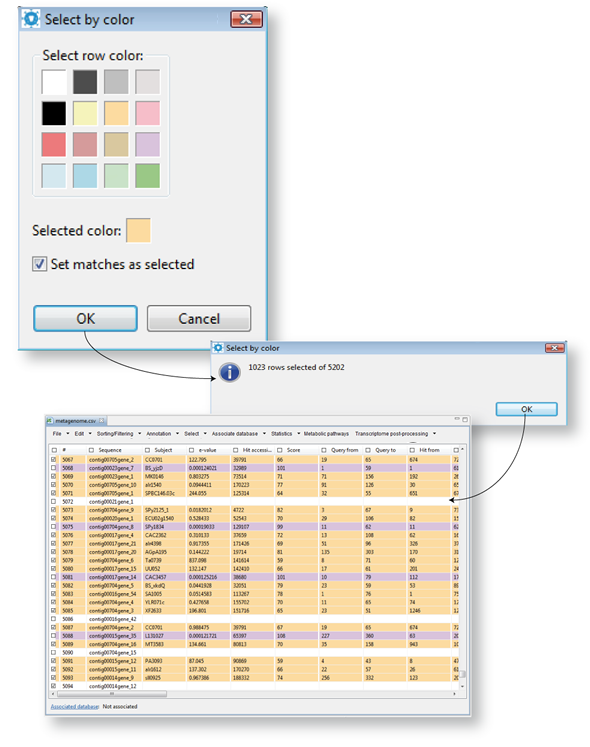
This tab provides an additional utility for selecting previously colored rows (Figure 14.11). Just choose one of the colors (orange in the example) corresponding to the rows previously colored according to your criteria, press OK to run the script.
| Figure 14.11.- Selecting sequences sets by colors |
Selecting sequences by multiple criteria
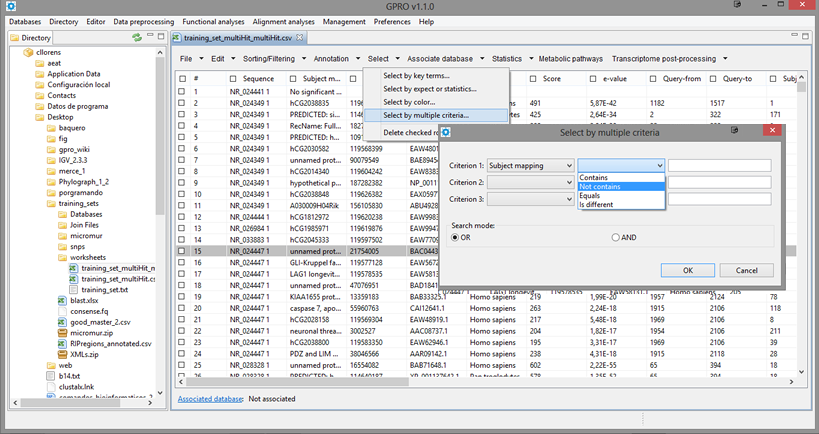
This is for selecting sequences according to a combined criteria of selection based on the terms found in up to three columns. As shown in Figure 14.12 by selecting this option, a dialog table appears for you to select three columns a search term for each column.
| Figure 14.12.- Selecting sequences by multiple criteria |
Delete checked sequences from the Worksheet
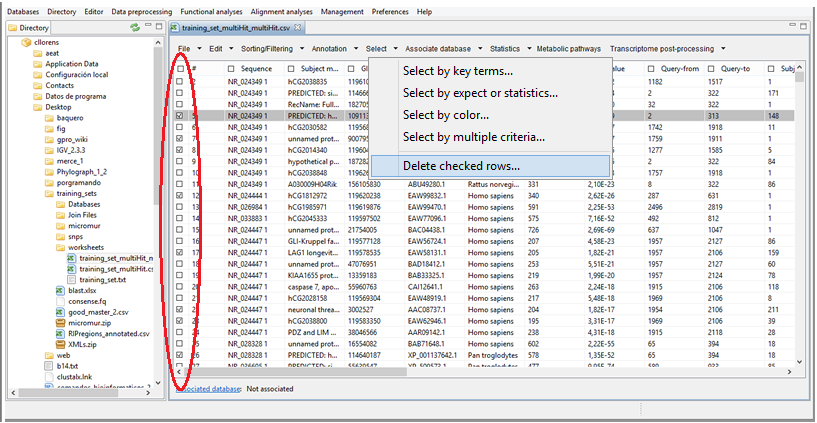
To delete all previously selected rows in the worksheet (Figure 14.13). To do this you only need to check the sequences you want to eliminate either manually or using any of the distinct utilities available in the Tab "Select" and then click on the last utility of this menu (delete checked rows).
| Figure 14.13.- Remove checked sequences (those selected in the red circle) from your worksheet |
Using this tab you can associate a specific FASTA file with its automatic annotation in a CSV using the worksheet and one column as common criterion reference. To make the association the contents of the selected columns must be found in the FASTA header of the sequences within the fasta file.
Associate fasta sequences to your annotation CSV file
By clicking on the “Associate database” Tab, you open a new window for database association (Figure 14.14). Then use the “worksheet columns” option to select on the left area a reference columns for the association (in the example “Sequence” and “Function”) and move it to the right area named "Sequence columns" (manually by selecting it and dragging it with the mouse). If required, choose the column separator char. Then browse the FASTA file of your interest in your directory. The script will present a preview of the worksheet selected sequence columns titles and that of the FASTA header. Press OK for running the script.If the association was successful you will be noticed (the link in a red circle below to worksheet GUI),any change performed in the worksheet column will be automatically applied to the FASTA header of the sequence associated with the worksheet row in the FASTA file.
| Figure 14.14.-Associate a fasta file to your CSV worksheet |
Remove association between your fasta file and the CSV
Associations between the worksheet and database file are maintained even if GPRO is closed. This option allows you to remove such an association.
The Tab “Statistics” permits to perform some statistics based on the results distribution, which depending on the column can be categorical or numerical. Figure 14.15 below summarizes both two possibilities.
Numerical data statistics
For analyzing quantitative data, just select the path Statistics -> Numerical Data statistics, and pop-up (Figure 14.15 to the left) wuill appear allowing you to select the column of interest and in the case of e-value-based data also select a log10-based distribution of the results.
Categorical data statistics
Figure 14.15 (to the rigth) shows the alternative path Statistics -> Categorical Data Statistics you can select for analyzing results distribution based on cualitative data (i.e. names, species etc). The device allows you to perform the analyses either as a Bar or a Pie char, in horizontal or vertical orientation, tuned in any color and in 2D or 3D mode similarly to the statistics based on GO annotation discussed above. By rigth clicking, you can export the image or the data as a matrix table in a csv for further editing with other programas such as Excel.
| Figure 14.15.- Analyzing the the results distribution of both worksheet data per column |
Metabolic pathways
Should you have previously performed a functional annotation for appending GO terms and enzyme codes to the worksheet and have internet access you can use this tool for linking the KEEG: Kyoto Encyclopedia and retrieve graphical figures of the metabolic maps on which the annotated enzymes are functionally involved. As shown in Figure 14.16, you only need to select the CSV columns summarizing the sequences names, the enzyme code and the Evidence code of sequences under study. Then click run and wait, the process will take some time depending on the number of sequences in your annotation. Once the process is donde, GPRO will open a working space in the layout below the worksheet with a summary to navigate the metabolic maps, and a display to the rigth of the map. Below, this layout you have also a detail of the metabolic path displayed, and above the layout you have three tabs for working with the maps or for downloading all of them in a folder that will be deposited in the projecto folder.
|
Figure 14.16.- Retrieving metabolic maps from KEEG |
This Tab permits you to make downstream curation of transcriptome sequence data in two different ways.
Filter best isoform
By selecting the option "Filter best isoform" you can reads the annotation CSV file of the whole transcriptome under analysis and then to state one or more classificatory filters to select the most representative sequences among the distinct cDNAs annotated per gene transcribed using an Algorithm shown in Figure 14.17 which is a normalized combination of the most relevant BLAST statistics such as the high-scoring segment pairs (HSPs) of both, the query and the hit as well as the similarity and the inverse of the E-value and the sequencing depth. You can state the filter based on any these filters or based on all of them.
You can also filter the clusters by positionaly redundancy, to detect and select all nor-overlapping sets of isotigs/contigs of a gene partually characterized and then select the best isoform within each one of these non-overlapping sets (in a red circle within the figure).
|
Figure 14.17.- Filter best isoform |
Sequence trimming
Using this utility you can upload both the fasta file with your cDNA sequences and its associated annotation CSV file and then trim the fasta sequences, according to two options:
a) Option "a" combines two algorithms based on the combination of the HSPs for noth the query and the hit for detecting and classifing the sequencs as full-lenght cDNA or partial CDNAs depending on if the queries share a core percentage with the subject hit established by the user. For instance we can define a sequence as full-length if the query share a core of more than 80% with the subject. The tool obviously assumes that you use the appropiate subject models as reference.
b) Option "b" is simpler than option "b" as it just considers the ratio between the HSPs of the query and the subject to consider full-length sequences or partial domains, depending of the criterion of shared core defined by the user.
Finally, the tool permits you to label the sequences as "full-length CDNAs, "Partial Sequence" or "Related Domain" depending on the core shared and then to trim upstream and donwstream each sequence to eliminate frames respectively upstream and downstream from the start codon and stop codon or from the defined core.
|
Figure 14.18.- Classify and trim sequences into full-length or partial CDNAs |

